


Financial Highlights / Financial Highlights (Data)
From the fiscal year ended December 31, 2017(IFRS)
-
Revenue (Billions of Yen)
-
Operating profit (Billions of Yen)
-
Profit attributable to owners of parent
(Billions of Yen)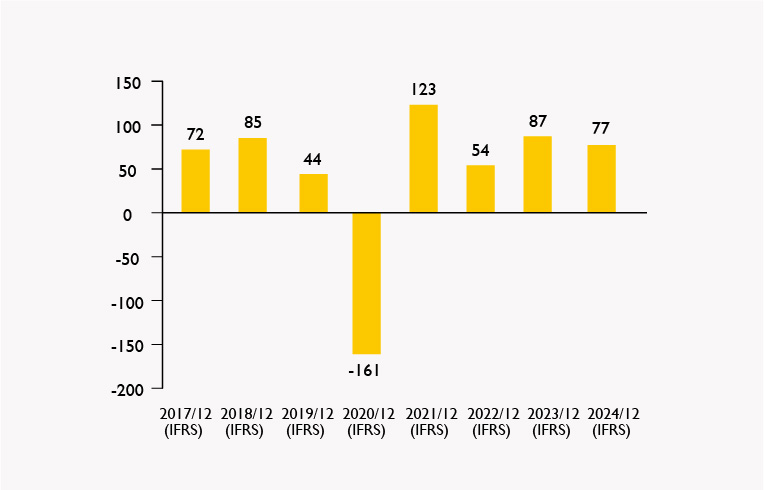
-
Total Assets (Billions of Yen)
-
Total equity (Billions of Yen)
-
Ratio of equity attributable to owners of parent to total assets (%)
Financial Highlights
The Company has voluntarily applied International Financial Reporting Standard (IFRS) from the first quarter of fiscal 2018.
The data of the fiscal 2017 is also presented based on IFRS for comparison.
Due to the impact of reclassifying the real estate business as a discontinued operation in 4Q FY2025, the quarterly data for FY2025 will be disclosed once preparation is completed.
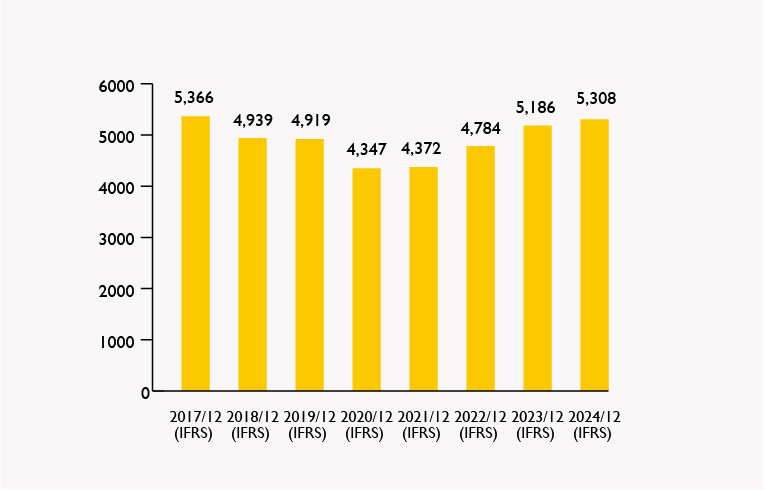
Revenue (Billions of Yen)
| IFRS* | |||||||||||||||||
| 2017/12 | 2018/12 | 2019/12 | 2020/12 | 2021/12 | 2022/12 | 2023/12 | 2024/12 | ||||||||||
| Annual | 536.6 | 493.9 | 491.9 | 434.7 | 437.2 | 478.4 | 518.6 | 530.8 | |||||||||
| 3rd Quarter | 390.7 | 381.0 | 382.7 | 315.3 | 309.1 | 345.8 | 377.7 | 385.6 | |||||||||
| 2nd Quarter | 250.7 | 241.7 | 242.9 | 200.0 | 199.7 | 213.8 | 238.5 | 247.7 | |||||||||
| 1st Quarter | 114.6 | 111.3 | 108.8 | 99.8 | 89.9 | 93.2 | 108.8 | 112.8 | |||||||||
Core operating profit (Billions of Yen)
| IFRS* | |||||||||||||||||
| 2017/12 | 2018/12 | 2019/12 | 2020/12 | 2021/12 | 2022/12 | 2023/12 | 2024/12 | ||||||||||
|---|---|---|---|---|---|---|---|---|---|---|---|---|---|---|---|---|---|
| Annual | 17.4 | 15.2 | 11.7 | 4.3 | 8.1 | 9.3 | 15.6 | 22.0 | |||||||||
| 3rd Quarter | 10.5 | 6.8 | 6.4 | 1.2 | 1.5 | 5.7 | 14.4 | 14.0 | |||||||||
| 2nd Quarter | 1.8 | (2.4) | (1.6) | (5.1) | (3.5) | (2.2) | 3.5 | 3.5 | |||||||||
| 1st Quarter | (3.2) | (5.0) | (5.9) | (6.2) | (6.9) | (6.4) | (2.9) | (3.8) | |||||||||
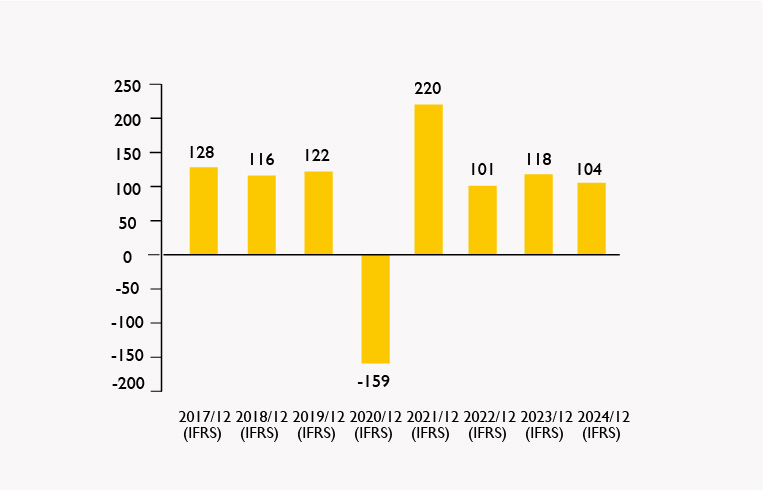
Operating profit (Billions of Yen)
| IFRS* | |||||||||||||||||
| 2017/12 | 2018/12 | 2019/12 | 2020/12 | 2021/12 | 2022/12 | 2023/12 | 2024/12 | ||||||||||
|---|---|---|---|---|---|---|---|---|---|---|---|---|---|---|---|---|---|
| Annual | 12.8 | 11.6 | 12.2 | (15.9) | 22.0 | 10.1 | 11.8 | 10.4 | |||||||||
| 3rd Quarter | 9.7 | 6.8 | 7.7 | (2.0) | 23.9 | 7.5 | 9.6 | 17.7 | |||||||||
| 2nd Quarter | 1.2 | (3.0) | (1.0) | (9.4) | 19.1 | (0.2) | (2.8) | 7.6 | |||||||||
| 1st Quarter | (3.7) | (5.5) | (4.2) | (6.1) | (6.2) | (4.5) | (3.3) | (1.9) | |||||||||
Profit attributable to owners of parent (Billions of Yen)
| IFRS* | |||||||||||||||||
| 2017/12 | 2018/12 | 2019/12 | 2020/12 | 2021/12 | 2022/12 | 2023/12 | 2024/12 | ||||||||||
|---|---|---|---|---|---|---|---|---|---|---|---|---|---|---|---|---|---|
| Annual | 7.2 | 8.5 | 4.4 | (16.1) | 12.3 | 5.4 | 8.7 | 7.7 | |||||||||
| 3rd Quarter | 5.3 | 4.2 | 4.6 | (0.9) | 15.7 | 5.3 | 3.1 | 11.5 | |||||||||
| 2nd Quarter | (0.2) | (2.5) | (0.8) | 6.4 | 12.3 | (0.4) | (5.1) | 6.1 | |||||||||
| 1st Quarter | (3.4) | (4.3) | (3.6) | (4.6) | (5.2) | (4.0) | (3.6) | (2.0) | |||||||||
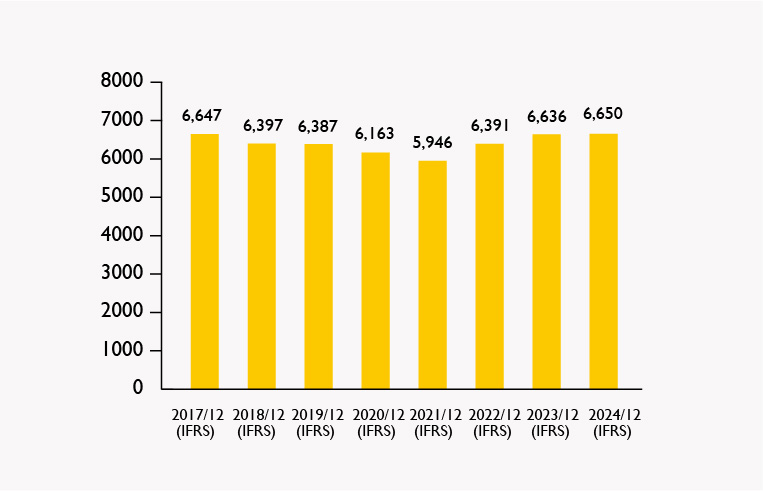
Total Assets (Billions of Yen)
| IFRS* | |||||||||||||||||
| 2017/12 | 2018/12 | 2019/12 | 2020/12 | 2021/12 | 2022/12 | 2023/12 | 2024/12 | ||||||||||
|---|---|---|---|---|---|---|---|---|---|---|---|---|---|---|---|---|---|
| Annual | 664.7 | 639.7 | 638.7 | 616.3 | 594.6 | 639.1 | 663.6 | 665.0 | |||||||||
| 3rd Quarter | 658.9 | 644.8 | 645.1 | 643.7 | 576.8 | 640.0 | 657.2 | 667.5 | |||||||||
| 2nd Quarter | 640.2 | 643.9 | 639.3 | 616.7 | 580.9 | 591.5 | 644.5 | 689.0 | |||||||||
| 1st Quarter | 622.1 | 630.3 | 625.5 | 609.1 | 602.4 | 590.3 | 620.5 | 667.6 | |||||||||
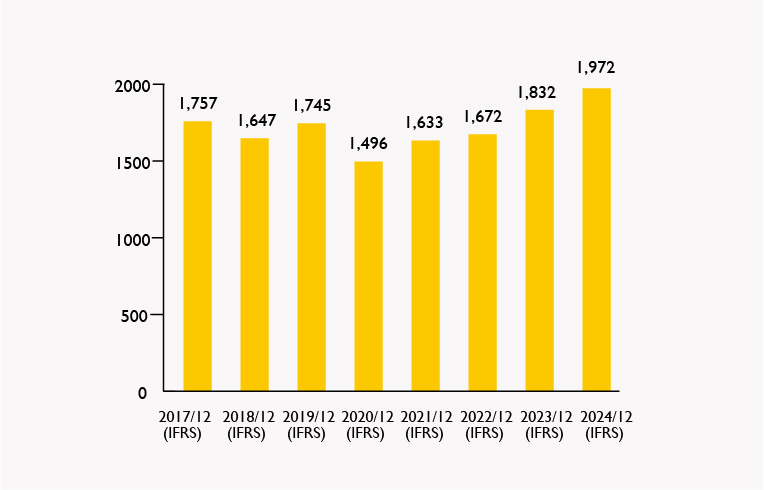
Total equity (Billions of Yen)
| IFRS* | |||||||||||||||||
| 2017/12 | 2018/12 | 2019/12 | 2020/12 | 2021/12 | 2022/12 | 2023/12 | 2024/12 | ||||||||||
|---|---|---|---|---|---|---|---|---|---|---|---|---|---|---|---|---|---|
| Annual | 175.7 | 164.7 | 174.5 | 149.6 | 163.3 | 167.2 | 183.2 | 197.2 | |||||||||
| 3rd Quarter | 170.2 | 170.9 | 172.1 | 163.1 | 167.8 | 174.1 | 181.0 | 200.6 | |||||||||
| 2nd Quarter | 162.6 | 161.8 | 165.7 | 156.6 | 161.9 | 166.4 | 171.6 | 204.4 | |||||||||
| 1st Quarter | 154.5 | 159.7 | 166.3 | 152.7 | 145.6 | 160.1 | 163.0 | 188.2 | |||||||||
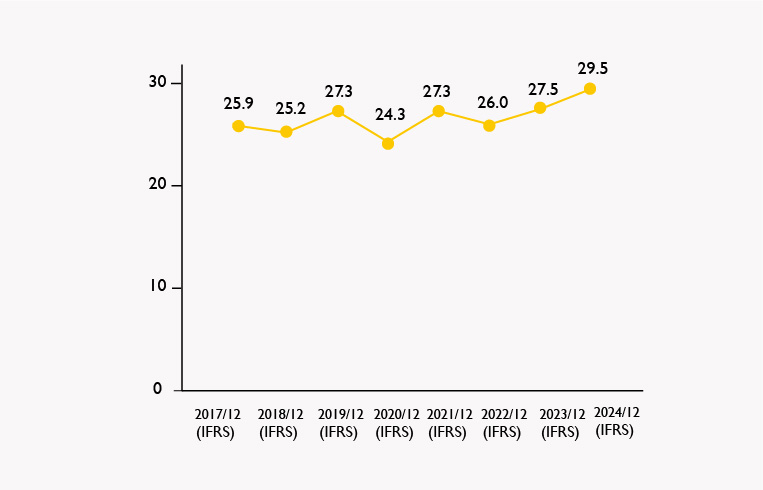
Ratio of equity attributable to owners of parent to total assets (%)
| IFRS* | |||||||||||||||||
| 2017/12 | 2018/12 | 2019/12 | 2020/12 | 2021/12 | 2022/12 | 2023/12 | 2024/12 | ||||||||||
|---|---|---|---|---|---|---|---|---|---|---|---|---|---|---|---|---|---|
| Annual | 25.9 | 25.2 | 27.3 | 24.3 | 27.3 | 26.0 | 27.5 | 29.5 | |||||||||
| 3rd Quarter | 25.2 | 26.0 | 26.3 | 25.3 | 29.0 | 27.1 | 27.4 | 29.9 | |||||||||
| 2nd Quarter | 24.8 | 24.6 | 25.5 | 25.4 | 27.7 | 28.0 | 26.5 | 29.5 | |||||||||
| 1st Quarter | 24.1 | 24.8 | 26.1 | 25.0 | 24.2 | 27.0 | 26.1 | 28.0 | |||||||||
Equity per share attributable to owners of parent (Yen)
| IFRS* | |||||||||||||||||
| 2017/12 | 2018/12 | 2019/12 | 2020/12 | 2021/12 | 2022/12 | 2023/12 | 2024/12 | ||||||||||
|---|---|---|---|---|---|---|---|---|---|---|---|---|---|---|---|---|---|
| Annual | 2,208.87 | 2,073.54 | 2,234.65 | 1,922.80 | 2,086.96 | 2,134.98 | 2,340.41 | 2,515.68 | |||||||||
Basic earnings per share (Yen)
| IFRS* | |||||||||||||||||
| 2017/12 | 2018/12 | 2019/12 | 2020/12 | 2021/12 | 2022/12 | 2023/12 | 2024/12 | ||||||||||
|---|---|---|---|---|---|---|---|---|---|---|---|---|---|---|---|---|---|
| Annual | 92.27 | 109.40 | 55.92 | (206.31) | 158.30 | 69.96 | 111.99 | 99.00 | |||||||||
| 3rd Quarter | 68.01 | 54.04 | 58.55 | (11.87) | 201.95 | 67.93 | 39.26 | 147.66 | |||||||||
| 2nd Quarter | (2.41) | (32.30) | (10.41) | (82.53) | 158.42 | (4.96) | (65.52) | 78.04 | |||||||||
| 1st Quarter | (43.29) | (55.03) | (46.09) | (59.69) | (66.75) | (51.26) | (46.16) | (25.38) | |||||||||
Change of Financial Data
The Company has voluntarily applied International Financial Reporting Standard (IFRS) from the first quarter of fiscal 2018. The data of the fiscal 2017 is also presented based on IFRS for comparison.
| IFRS* | ||||||||||||||||||||
|---|---|---|---|---|---|---|---|---|---|---|---|---|---|---|---|---|---|---|---|---|
| 2017/12 | 2018/12 | 2019/12 | 2020/12 | 2021/12 | 2022/12 | 2023/12 | 2024/12 | 2025/12 | ||||||||||||
| Revenue (Billions of Yen) | 536.6 | 493.9 | 491.9 | 434.7 | 437.2 | 478.4 | 518.6 | 530.8 | 506.9 | |||||||||||
| Core operating profit (Billions of Yen) | 17.4 | 15.2 | 11.7 | 4.3 | 8.1 | 9.3 | 15.6 | 22.0 | 25.0 | |||||||||||
| Operating profit (Billions of Yen) | 12.8 | 11.6 | 12.2 | (15.9) | 22.0 | 10.1 | 11.8 | 10.4 | 24.4 | |||||||||||
| Profit attributable to owners of parent (Billions of Yen) | 7.2 | 8.5 | 4.4 | (16.1) | 12.3 | 5.4 | 8.7 | 7.7 | 19.5 | |||||||||||
| Total Assets (Billions of Yen) | 664.7 | 639.7 | 638.7 | 616.3 | 594.6 | 639.1 | 663.6 | 665.0 | 653.7 | |||||||||||
| Equity attributable to owners of parent (Billions of Yen) | 175.7 | 164.7 | 174.5 | 149.6 | 163.3 | 167.2 | 183.2 | 197.2 | 220.1 | |||||||||||
| Ratio of equity attributable to owners of parent to total assets (%) | 25.9 | 25.2 | 27.3 | 24.3 | 27.3 | 26.0 | 27.5 | 29.5 | 33.5 | |||||||||||
| Equity per share attributable to owners of parent (Yen) | 441.77 | 414.71 | 446.93 | 384.56 | 417.39 | 427.00 | 468.08 | 503.14 | 561.41 | |||||||||||
| Basic earnings per share (Yen) | 18.45 | 21.88 | 11.18 | (41.26) | 31.66 | 13.99 | 22.40 | 19.80 | 50.02 | |||||||||||
The Company conducted a five-for-one stock split of its common shares, effective January 1, 2026.
・Share prices for prior periods are presented on a post-split adjusted basis.