


Initiatives to Address Climate Change and Natural Capital

Sapporo Holdings endorses the recommendations of the TCFD, which encourages companies to assess, manage, and disclose information on the risks and opportunities of climate change, and is actively promoting information disclosure.
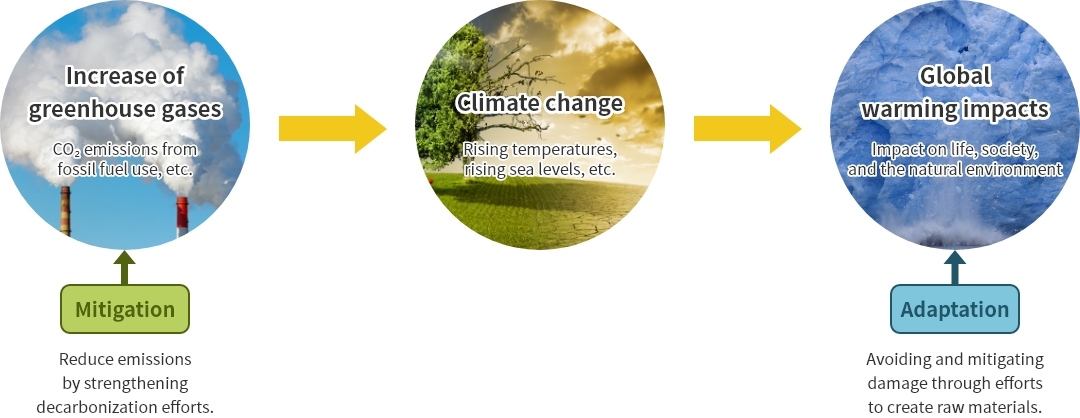
Recognizing that addressing climate change is one of the most important issues to be addressed on a global scale, we are working to resolve issues from both mitigation and adaptation perspectives. We have identified risks and opportunities based on scenario analysis of multiple possible future business environments, and are reflecting the results in our strategies and initiatives.

Sapporo Holdings recognizes that, for a company like ours, which relies on resources such as agricultural crops and water, addressing natural capital, in addition to climate change, is a critical issue.
In January 2024, Sapporo Holdings registered as an adopter of the disclosure recommendations published by the Taskforce on Nature-related Financial Disclosures (TNFD) in September 2023.
Since FY2023, we have been assessing our relationship with nature in line with the LEAP approach recommended by the TNFD, incorporating these findings into our strategies and initiatives. We will continue to strengthen our environmental conservation activities.
Governance
Sapporo Group has established the Group Sustainability Committee, chaired by the President and Representative Director of Sapporo Holdings, as an advisory body to the Management Council* to promote and oversee environmental conservation activities for the entire Group and to support the environmental management initiatives of each operating company.
The Group Risk Management Committee is incorporated into overall risk management, and the committee secretariat reports semiannually to the Board of Directors on the occurrence of climate-related risks, water risks, and nature-related risks within the Group, as well as on the responses and measures to prevent their recurrence. The Sustainability Committee formulates overall policies to promote sustainability management throughout the Group, coordinates within the Group, and the director in charge reports semiannually to the Board of Directors on progress in addressing climate change-related issues. The Board of Directors monitors and supervises the efforts to address these reported issues and the targets set.
(note) Corporate governance and internal control
Support for Public Policy
The Sapporo Group is a member of the Japan Climate Initiative (JCI). JCI was established as a platform to strengthen information dissemination and opinion exchanges, and to collaborate with international movements, particularly those in the United States. It is a network that brings together a diverse range of non-state actors, including companies, local governments, organizations, and NGOs, that are actively engaged in addressing climate change. JCI aims to realize a decarbonized society in line with the goals of the Paris Agreement. The Sapporo Group engages in advocacy and communication with governments alongside a joint statement with other supporting companies. Past initiatives include proposals calling for more ambitious government targets under the Paris Agreement and for increasing the share of electricity generated from renewable energy sources.
Strategy
Climate Change
Sapporo Group formulated the Sapporo Group Environmental Vision 2050 in 2019 with the aim of realizing a decarbonized society, and is working to prevent global warming by reforming its business structure with a decarbonization orientation, thoroughly implementing energy-saving measures, and utilizing renewable energy.
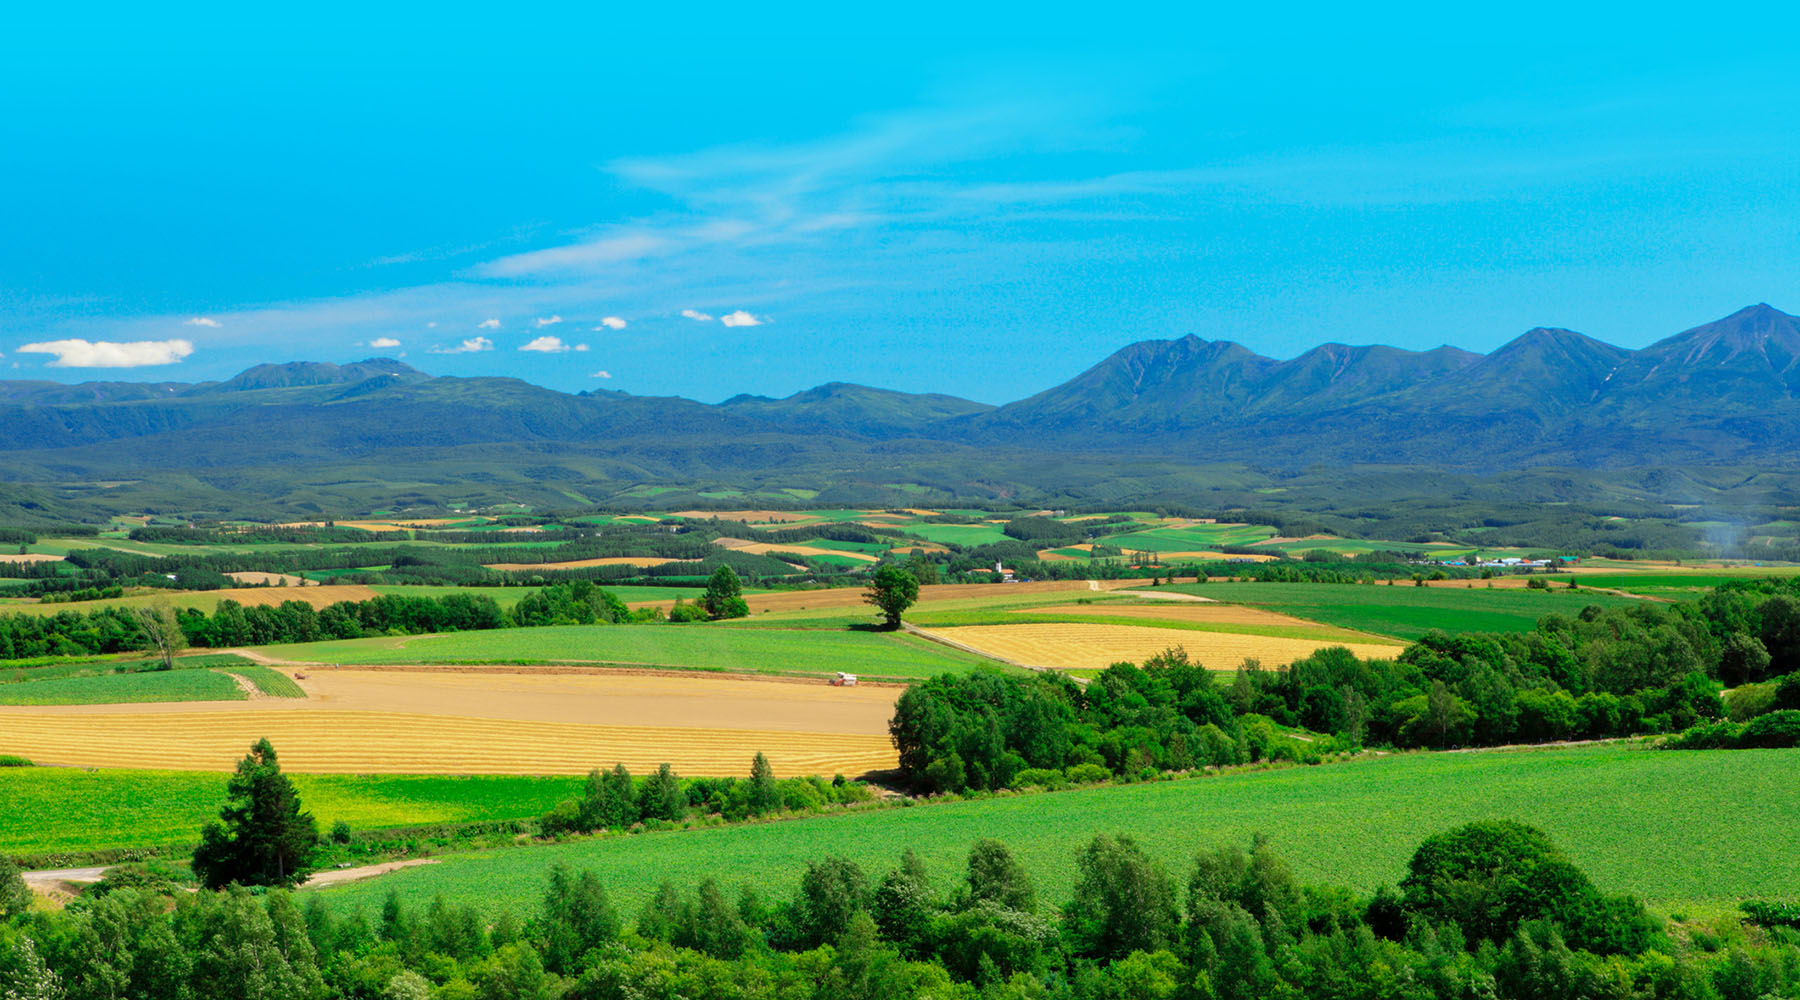
In this context, in our core beer business, we have been breeding our own barley and hops, the main raw materials, since our founding in 1876, and have adopted a unique raw material procurement system called "cooperative contract farming" since 2006. In the future, assuming the impact of each of the scenarios described below on the yield of raw materials, we will work to develop new varieties and ensure stable procurement in cooperation with universities, research institutions, and suppliers in Japan and overseas, based at the Sapporo Brewery Material Development Laboratory. We will also strengthen cooperation with suppliers to ensure stable procurement of corn and rice as secondary materials.
We will take on the challenge of resolving climate change issues from the perspectives of mitigation and adaptation* through our group-wide efforts to thoroughly decarbonize and our efforts to produce raw materials, which we have cultivated over 140 years in the beer business, aiming to become a resilient corporate entity and contribute to the building of a sustainable society.
* Mitigation: Curbing the emission of greenhouse gases
Adaptation: Adjusting the nature and human society to cope with the effects of global warming (from Ministry of the Environment data)
Natural Capital
Sapporo Group utilizes natural resources such as agricultural products and water in its business activities. At the same time, we recognize that we impose environmental burdens, such as through land use. As the degradation of nature accelerates, we believe it is essential to understand our dependence on and impact on nature, along with the associated risks and opportunities, and to actively implement countermeasures. Furthermore, when implementing measures to address natural capital, we believe it is important to align them with climate change measures, as nature and climate are closely interconnected. In the Sapporo Group Environmental Vision 2050, we have committed to realizing a society in harmony with nature. As part of this vision, we will promote the sustainable procurement of raw materials and the development of cities where people can enjoy rich spaces and experiences in harmony with nature, while also aligning efforts to adapt to climate change. By advancing these initiatives, we aim to contribute to the realization of a nature-positive society, where nature loss is halted and put on a path to recovery.
Assessment of Nature-related Risks and Opportunities in Accordance with the LEAP Approach
The assessment of nature-related risks and opportunities was conducted in accordance with the LEAP approach recommended by the TNFD. We analyzed the entire supply chain of Sapporo Group's main businesses—alcoholic beverages, food and beverage, and real estate—before narrowing our focus to 'barley and hop production' for a more detailed evaluation following the LEAP approach.

Analysis of all businesses and selection of evaluation subjects (Scoping)
We organized the main industrial processes across the entire supply chain for alcoholic beverages, food and beverage, and real estate. Using TNFD’s recommended tool, ENCORE, along with internal information, we mapped dependencies and impacts on nature in a heat map.
Heatmap of nature-related impacts across all business sectors
| Business sectors | Supply chain | Your company's industrial processes | Land use | Resource extraction | Climate change | Pollution | Invasive species | |||||||
|---|---|---|---|---|---|---|---|---|---|---|---|---|---|---|
| Area of land use | Area of freshwater use | Area of seabed use | Water resources | Other resources | Emissions of GHG | Air pollution | Water pollution | Soil pollution | Solid waste | Disturbances | Biological change | |||
| Alcoholic beverages・Food and beverage | Upstream | Production of agricultural products | ||||||||||||
| Water | ||||||||||||||
| Packaging paper (paper production) | ||||||||||||||
| Packaging paper (forestry) | ||||||||||||||
| Transportation of raw materials | ||||||||||||||
| Direct operations | Alcoholic fermentation and distilling | |||||||||||||
| Manufacturing of processed food and beverages | ||||||||||||||
| Food service | ||||||||||||||
| Downstream | Transportation of processed foods and beverages | |||||||||||||
| Food retailers of processed foods and beverages | ||||||||||||||
| Disposal of processed foods and beverages | ||||||||||||||
| Real estate | Upstream | Construction | ||||||||||||
| Direct operations | Real estate | |||||||||||||
| Downstream | Use of real estate | |||||||||||||
- Very high
- High
- Moderate
- Low
Heatmap of nature-related dependencies across all business sectors
| Business sectors | Supply chain | Your company's industrial processes | Provisioning services | Regulating services | Cultural services | ||||||||||||||||
|---|---|---|---|---|---|---|---|---|---|---|---|---|---|---|---|---|---|---|---|---|---|
| Materials such as fibers | Groundwater | Surface water | Pollination | Soil quality regulation | Ventilation function | Water flow maintenance | Water quality regulation | Decomposition function | Dilution function | Filtration function | Mediation of sensory Impacts | Mass flow rate regulation | Climate regulation | Suppression of infectious diseases | Flood & storm mitigation | Erosion control | Pests control | ||||
| Alcoholic beverages・Food and beverage | Upstream | Production of agricultural products | |||||||||||||||||||
| Water | |||||||||||||||||||||
| Packaging paper (paper production) | |||||||||||||||||||||
| Packaging paper (forestry) | |||||||||||||||||||||
| Transportation of raw materials | |||||||||||||||||||||
| Direct operations | Alcoholic fermentation and distilling | ||||||||||||||||||||
| Manufacturing of processed food and beverages | |||||||||||||||||||||
| Food service | |||||||||||||||||||||
| Downstream | Transportation of processed foods and beverages | ||||||||||||||||||||
| Food retailers of processed foods and beverages | |||||||||||||||||||||
| Disposal of processed foods and beverages | |||||||||||||||||||||
| Real estate | Upstream | Construction | |||||||||||||||||||
| Direct operations | Real estate | ||||||||||||||||||||
| Downstream | Use of real estate | ||||||||||||||||||||
- Very high
- High
- Moderate
- Low
Alcoholic beverages and food and beverages
In the case of 'alcoholic beverages' and 'food and beverages,' it is believed that both upstream and direct operations have significant dependencies and impacts related to the production of agricultural products that serve as raw materials. Specifically, the dependencies include stable climate conditions provided by nature, while the impacts encompass water usage, land use, and greenhouse gas emissions. Based on the assessment results, we will collaborate with suppliers to reduce the environmental impact during agricultural production. In particular, regarding greenhouse gas emissions, we set targets for FLAG greenhouse emissions in March 2024 and have obtained SBT certification. Moving forward, we will continue our efforts to achieve these reductions.
The production of paper used for container packaging is also believed to have significant impacts and dependencies on nature. We are currently working on packaging methods that reduce paper usage and will continue to advance this effort. Additionally, it is believed that our direct operations, which include alcohol fermentation and distillation as well as the manufacturing of processed food and beverages, have a strong dependence on water. We have set a target for reducing water usage at our factories by 2030 and will continue our efforts to achieve this goal.
Real estate
It is believed that our use of real estate significantly depends on ecosystem services and impacts greenhouse gas emissions. We are working toward achieving 100% renewable energy across all owned properties and generating our own energy for the electricity used by the Company. It is also believed that our use of real estate depends on ecosystem 'cultural services,' such as the restorative effects of green spaces. At Ebisu Garden Place, which we manage, we are advancing sustainable urban development by enhancing cultural services through initiatives such as greening public open spaces, providing a comfortable environment for visitors and users.
Based on the results of an analysis covering all business areas, we assigned weights to the number of items rated as 'very high,' 'high,' and 'moderate' to calculate the degree of dependence and impact for each industrial process within our Group’s 'alcoholic beverages,' 'food and beverages,' and 'real estate' sectors, organizing the findings in a matrix. As a result, it was found that agricultural production within the 'alcoholic beverages and food and beverages' business has the highest levels of dependence and impact among industrial processes. Considering these findings, we have decided to conduct a more detailed assessment of the agricultural products used as raw materials.
Matrix of dependence and impact across all business sectors

Analysis by crop
The degree of dependence and impact of agricultural production in the 'alcoholic beverages and food and beverages' business varies by crop. Therefore, we referred to various materials, including the TNFD Sector Guidance, the High Impact Commodity List created by the Science Based Targets Network (SBTN), datasets on water footprint, and scientific papers, to conduct crop-specific analyses and organize the results in a heatmap. Based on the analysis results, we believe that we should prioritize our efforts on 'barley' and 'hops,' which have significant dependencies and impacts on nature in terms of water and land use, as well as large procurement scales. Therefore, we have selected them as subjects for detailed assessment following the LEAP approach.
Analysis results by crops
| Crops | Land use | Resource extraction | Pollution | Provisioning services | Regulating services | Procurement scale (amount) | ||||||||||||||||||
|---|---|---|---|---|---|---|---|---|---|---|---|---|---|---|---|---|---|---|---|---|---|---|---|---|
| Area of land use | Area of freshwater use | Water resources | Water pollution | Soil pollution | Materials such as fibers | Groundwater | Surface water | Pollination | Soil quality regulation | Water flow maintenance | Water quality regulation | Decomposition function | Dilution function | Filtration function | Mass flow rate regulation | Climate regulation | Suppression of infectious diseases | Flood & storm mitigation | Erosion control | Pests control | Up to 1 billion yen | 1 to 5 billion yen | Over 5 billion yen | |
| Barley | ||||||||||||||||||||||||
| Hop | ||||||||||||||||||||||||
| Grapes | ||||||||||||||||||||||||
| Lemons | ||||||||||||||||||||||||
| Corn | ||||||||||||||||||||||||
| Tea leaves | ||||||||||||||||||||||||
| Coffee beans | ||||||||||||||||||||||||
| Soybeans | ||||||||||||||||||||||||
- Very high
- High
- Moderate
- Low
Discovery of points of contact with nature (Locate)
In the Locate phase, we organized information about the procurement sources for barley and hops and assessed the surrounding natural conditions. Since the magnitude of nature-related risks and opportunities varies by region, it is important to understand the locations of these procurement sources and proceed with the evaluation. Sapporo Group has ensured traceability for barley and hops and has identified the locations of the agricultural lands from which we source these products.
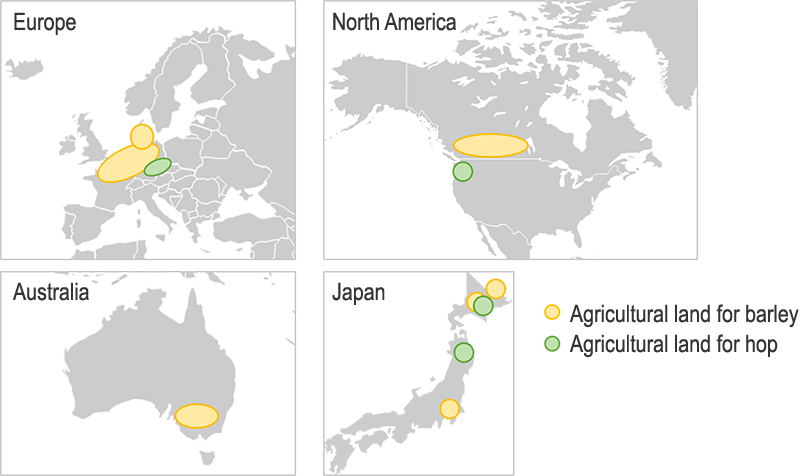
Using the organized location information of the agricultural lands, we assessed the surrounding natural environment to determine whether the area should be prioritized for evaluation and action from a nature-related perspective (priority area). The evaluation work was conducted at the agricultural land level using external tools to obtain data* in accordance with the five criteria defined by the TNFD: the importance of conservation, ecosystem intactness, rapid degradation of ecosystem intactness, the importance of ecosystem services, and physical water risk.
The country-level trends of the evaluation results are summarized in the following table. For barley procurement sources, it has been confirmed that farms are in regions with high water stress in Germany, Canada, and Australia. In these regions, we recognized the need to prioritize responses to the associated drought risks. Additionally, we observed cases where farmland for both barley and hops is located in areas with high ecosystem intactness, areas experiencing rapid degradation, and areas of high conservation importance. We acknowledged that these farmlands need to prioritize efforts to reduce environmental pressures such as land use and pollution.
The evaluation results of these priority areas are reflected in the assessment of the magnitude of risks and opportunities in subsequent evaluations. Moreover, future supplier engagement will be informed by these evaluation results and the characteristics of each region.
Evaluation results for priority areas of barley procurement sources
| Criteria | Trends in evaluation results at the country level |
|---|---|
| Importance of conservation | In every country, there was a high prevalence of farmland located near protected areas and Key Biodiversity Areas (KBAs). |
| Ecosystem intactness | In Germany and Japan, there was a high concentration of farmland located near areas with high ecosystem integrity. |
| Rapid degradation of ecosystem intactness | In France, Canada, and Australia, there was a high concentration of farmland situated near natural areas where ecosystem integrity is rapidly declining. |
| Physical water risk | In Germany, Canada, and Australia, a large proportion of farmland was located in areas experiencing high water stress. |
| Importance of ecosystem services | In Canada and Australia, farmland was found near areas managed by Indigenous Peoples and Local Communities (IPLCs). |
Evaluation results of priority areas in hop sourcing
| Criteria | Trends in evaluation results at the country level |
|---|---|
| Importance of conservation | In every country, there was a high prevalence of farmland located near protected areas and Key Biodiversity Areas (KBAs). |
| Ecosystem intactness | In the Czech Republic and Japan, there was a high concentration of farmland located near areas with high ecosystem integrity. |
| Rapid degradation of ecosystem intactness | In the Czech Republic and the United States, there was a high concentration of farmland situated near natural areas where ecosystem integrity is rapidly declining. |
| Physical water risk | Farmland in areas with high water stress was rarely found in any country. |
| Importance of ecosystem services | In the United States, farmland was found near areas managed by Indigenous Peoples and Local Communities (IPLCs). |
* The evaluation based on the five criteria was conducted using the following indicators and tools:
Importance of conservation: The IBAT (Integrated Biodiversity Assessment Tool) was used to assess the proximity to areas with high conservation value, such as protected areas and Key Biodiversity Areas (KBAs).
Ecosystem intactness: The Biodiversity Intactness Index (BII) provided by the Natural History Museum was used to evaluate ecosystem integrity.
Rapid degradation of ecosystem intactness: The WWF Biodiversity Risk Filter, which includes the "Pressure on Biodiversity" indicator, was used to assess the magnitude of impact on nature and evaluate rapid degradation.
Importance of ecosystem services: Global Forest Watch was used to assess proximity to Indigenous Peoples and Local Communities (IPLCs).
Physical water risk: Aqueduct was used to evaluate Baseline Water Stress.
Evaluation of dependencies and impacts (Evaluate)
In the Evaluate phase, we assessed how barley and hop production on the agricultural land identified in the Locate phase naturally depend on and impact the environment. Barley and hop production was found to have a natural impact on the environment in terms of land use, water use, and pollution. In particular, regarding water use, it was considered to be of high importance in areas identified as experiencing high water stress during the Locate phase. In terms of dependency, it was found that production relies on the benefits provided by nature, such as the use of compost and water, as well as the maintenance of soil, water, and pest control.

Among the various impacts, water and soil pollution caused by nitrogen fertilizers are among the most significant concerns. According to a presentation by an international research group, the environmental impact of nitrogen has been found to greatly exceed the 'Planetary Boundaries' (the Earth's sustainable limits).* Additionally, the use of nitrogen fertilizers not only causes pollution but also contributes to N2O, a greenhouse gas, making its reduction important from the perspective of climate change.
Therefore, efforts are currently underway to quantify the impact by monitoring the amount of nitrogen applied by each supplier. As a result, it has been found that nitrogen application levels vary across regions. Additionally, it has been observed that the use of compost and crop residues is particularly advanced in certain regions of Japan, the Czech Republic, and Germany. Efforts will be made to enhance communication on tracking nitrogen fertilizer application and optimizing fertilization practices.
※ Refer to the Stockholm Resilience Center website
Assessment of Nature-related Risks and Opportunities in Accordance with the LEAP Approach
Assessment of risks and opportunities (Assess)
Based on the results of the Locate and Evaluate phases, nature-related risks and opportunities associated with barley and hop production were identified, and their magnitude and likelihood were examined.
Regarding risks, in addition to the physical risks related to yield reduction and quality deterioration due to extreme weather events and pests—also assessed in climate change risk scenario analysis—we acknowledge transition risks, such as those associated with the 30by30 target and regulations on pesticide and fertilizer use. On the other hand, regarding opportunities, we recognize the potential in adopting technologies that reduce environmental impact and in developing new varieties.
| Item | Overview of risks | Impact period | Financial impact | Likelihood of occurrence | |
|---|---|---|---|---|---|
| Physical risks | Acute | Reduction in yield and quality due to pest and disease outbreaks | Medium-term | Small | High |
| Reduction in yield and quality due to climate disasters such as storms and floods | Short-term | Small | High | ||
| Reduction in yield and quality due to rising temperatures and droughts | Medium-term | Small | High | ||
| Chronic | Reduction in yield and quality due to water pollution, along with increased costs for water purification | Medium-term | Small | Medium | |
| Reduction in yield and quality due to the decline in soil health | Medium-term | Small | High | ||
| Transition risks | Policy | Increase in costs required to reduce FLAG-related emissions in response to greenhouse gas reduction targets | Short-term | Medium | Medium |
| Reduction or change in sourcing locations due to the expansion of protected areas for the 30by30 target and the protection of areas managed by IPLCs | Medium-term | Small | Low | ||
| Increase in response costs due to the strengthening of regulations related to pollution from chemical fertilizers, chemical pesticides, and other chemicals | Medium-term | Small | Medium | ||
| Reduction in yield and quality due to regulations such as water extraction restrictions during droughts | Short-term | Small | Medium | ||
| Technology | Increase in investment in agricultural technologies that reduce environmental impact, such as precision agriculture and regenerative agriculture, as well as in the development of crop varieties that contribute to reducing environmental impact and improving resilience, along with short-term yield reductions and cost increases due to the adoption of these technologies | Short-term | Small | Medium | |
| Market | Decline in revenue and market share due to changes in consumer preferences for products with lower environmental impact | Medium-term | Small | Medium | |
| Reputation | Reputation damage and loss of operating permits due to significant impacts on nature and other areas of high conservation importance | Long-term | Medium | Low | |
| Liability | Legal penalties and litigation costs arising from significant impacts on nature areas of high conservation importance | Long-term | Medium | Low | |
* Physical risks: Risks from direct impacts caused by climate phenomena themselves
Transition risks: Risks that must be addressed due to changes in policy, the economy, technology, and society
| Item | Overview of risks | Impact period | Financial impact | Likelihood of occurrence | |
|---|---|---|---|---|---|
| Opportunity | Resource efficiency | Optimization of fertilizer and pesticide application, as well as the reduction of costs and environmental impact through the introduction of energy-efficient machinery | Medium-term | Small | Medium |
| Reduction of water-related risks and costs through improved water use efficiency, as well as the securing and conservation of water sources | Short-term | Small | Medium | ||
| Product and service | Risk reduction through the adoption of environmentally-friendly farming practices, and the acquisition of market share in the environmentally-conscious food market | Long-term | Small | Medium | |
| Market | Cost reduction and enhanced resilience through the development of agricultural technologies and breeding focused on reducing environmental impact | Long-term | Small | High | |
| Introduction and development of agricultural methods and technologies that reduce environmental impact, along with the enhancement of brand image through biodiversity conservation activities | Long-term | Small | Medium | ||
| Capital | Funding through sustainable finance | Short-term | Medium | Medium | |
| Sustainable resource use | Development of climate-resilient crop varieties, as well as varieties that enable reduced water and fertilizer usage | Long-term | Large | High | |
| Conservation, restoration, and regeneration | Implementation of biodiversity conservation activities | Long-term | Small | High | |
Consideration of countermeasures (Prepare)
Based on the risk and opportunity assessment results from the Assess phase, we organized and reviewed countermeasures and strategic directions, incorporating current initiatives. Regarding the concern about the short-term likelihood of the "increase in costs required to reduce FLAG-related emissions in response to greenhouse gas reduction targets," we are refining the calculation of FLAG-related emissions and investigating the feasibility of obtaining activity data as well as identifying potential challenges. Additionally, regarding the significant financial impact of the "development of climate-resilient crop varieties, as well as varieties that enable reduced water and fertilizer usage," we will explore the potential within the context of the current development goals we have set.
Scenario Analysis Results
We conducted a scenario analysis for procurement areas of agricultural products used as raw materials for beer and other products, which are expected to be affected by climate change. Based on scenario analysis data from the Food and Agriculture Organization of the United Nations (FAO) and other sources, the analysis was corrected to take into account factors such as extreme weather events, and assumed changes in yields up to 2050 for three scenarios that differ in climate change factors, economic and social factors, and factors related to production volume.
| Temperature increase | Extreme weather events (typhoons, floods, droughts, etc.) | Agriculture-related trends | Other social trends | |
|---|---|---|---|---|
| Sustainability Progress scenario | 1.5°C | Increase to some extent (-) | Tighter regulations on the use of chemical fertilizers, etc. (-) | Population growth, improved living standards, increased demand for food, and some increase in food prices |
| Sustainability Standard scenario | BAU | Increased frequency and damage (-) | Increase in variety improvement and capital investment (+) | Population growth, higher living standards, increased demand for food, higher food prices |
| Sustainability Stagnation scenario | 4°C | Severe increase (-) | Increase in crop diseases and damage to agriculture (-) | Higher food prices, more difficult access to food for the poor |
+: Positive impact on yields -: Negative impact on yields
* The values of temperature increase were changed in March 2024 to the general standard values.
Projected changes in yields in major sourcing countries
The sustainability progress scenario assumes a negative impact on yields due to the impact of restrictions on the use of chemical fertilizers. In countries where yield estimates are on an upward trend, yields may increase or remain flat despite the negative factors in the table above.
Barley
| Progress | Standard | Stagnation | |
|---|---|---|---|
| Europe | |||
| North America | |||
| Oceania | |||
| East Asia |
Hop
| Progress | Standard | Stagnation | |
|---|---|---|---|
| Europe | |||
| North America | |||
| Oceania | |||
| East Asia |
Corn
| Progress | Standard | Stagnation | |
|---|---|---|---|
| North America | |||
| South America |
Rice
| Progress | Standard | Stagnation | |
|---|---|---|---|
| East Asia |

- : >5%

- : ±5% or less

- : <-5%
It indicates whether the estimated yield in 2050 is increasing (↑), remaining flat (→), or decreasing (↓) compared to the yield in 2018.
Financial Impact Analysis
Impact on Raw Agricultural Commodity Procurement
In 2023, based on the results of the above scenario analysis, we conducted a financial impact analysis on the following items expected to have a significant impact on the procurement cost of raw materials. This analysis is based on Sapporo Breweries' total procurement in the fiscal year 2022, calculating only the price increase due to climate change-related impacts.
Expansion of Organic Cultivation Due to Strengthened Environmental Regulations
We are calculating the financial impact in the scenario where the use of chemical fertilizers and pesticides is restricted, and organic cultivation becomes widespread globally.
In organic cultivation, price increases are expected due to reasons such as 'reduced yield,' 'increased labor costs for weed control and pest management,' and 'cost increases due to the switch to organic fertilizers and natural pesticides instead of chemical fertilizers and pesticides.'
The price increase was estimated by calculating the rate of increase in raw material prices derived from organic cultivation, based on market price data for conventional and organically cultivated products, and projecting the incremental cost.
Rising Procurement Costs Due to Soaring Energy Prices
We are estimating future energy prices based on the 'World Energy Outlook' released by the International Energy Agency (IEA). The percentage of energy prices in production costs for each raw material has been calculated, and the impact of the increase in energy prices on production costs has been assessed. Additionally, we have calculated the influence of the rise in energy prices on fertilizer manufacturing costs, reflecting this impact in the production costs of raw materials.
Increase in Raw Material Prices Due to Decreased Yields of Ingredients (Barley, Hops, Corn)
We referred to forecast data on past changes in raw material yields and literature on the impact of climate change on crops to estimate the amount of impact. We set the rate of price increase based on the decrease in yield and estimated the raw material prices accordingly.
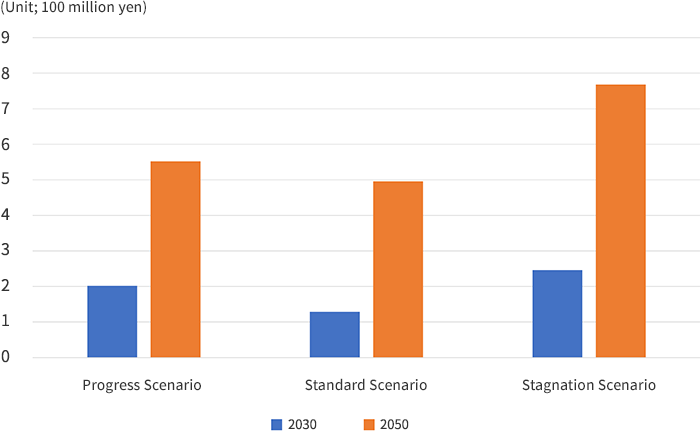
Summary of Analysis Results
By Scenario: Increase in Raw Material Prices Due to Climate Change (Compared to 2022)
(Unit: hundred million yen)
| 2030 | 2050 | |
|---|---|---|
| Progress scenario | 2.0 | 5.5 |
| Standard scenario | 1.3 | 5.0 |
| Stagnation scenario | 2.5 | 7.7 |
The scenario with the most significant financial impact in each case was the Stagnation Scenario. In the Stagnation Scenario, the impact of 'Rising Procurement Costs Due to Soaring Energy Prices' was the most substantial, resulting in an impact of 250 million yen in 2030 and 770 million yen in 2050 due to 'Increase in Raw Material Prices Due to Decreased Yields of Ingredients.'
The next scenario with significant impact was the Progress Scenario, where the effect of 'Expansion of Organic Cultivation Due to Strengthened Environmental Regulations' resulted in an impact of 200 million yen in 2030 and 550 million yen in 2050.
In the Standard Scenario, the impact of 'Increase in Raw Material Prices Due to Decreased Yields of Ingredients' and 'Expansion of Organic Cultivation Due to Strengthened Environmental Regulations' led to an impact of 130 million yen in 2030 and 500 million yen in 2050.
Financial Impact Results by Item
By Item: Increase in Raw Material Prices Due to Climate Change (Compared to 2022)
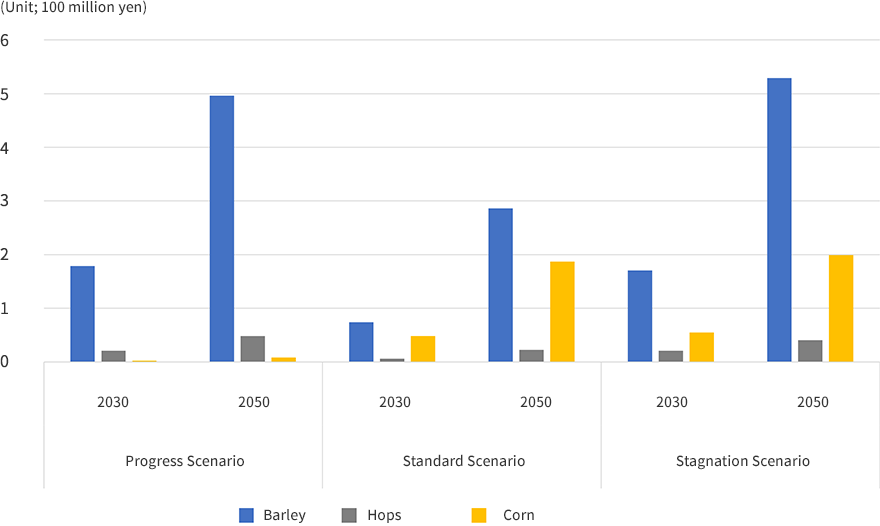
When looking at each item separately, barley (including malt), which has the highest procurement amount, became the item with the highest price increase in each scenario. In the Progress Scenario, the impact on each item is linked to the size of the procurement amount, but in the Standard and Stagnation Scenarios, corn, with the smallest procurement amount, became the second-highest in terms of price increase. This is because both the Standard and Stagnation Scenarios anticipate a significant decrease in corn yield, which is expected to have a substantial impact.
Impact of carbon tax on Scope 1 and 2
The financial impact of introducing a carbon tax was calculated based on the International Energy Agency's Net Zero Emissions (NZE) scenario, considering the energy consumption at our company's facilities. We analyzed the financial impact at the points of 2030 and 2050, examining the scenarios where our company could achieve and could not achieve its greenhouse gas reduction targets.
| Year | Emissions if greenhouse gas reduction targets are achieved (thousand tons) |
Emissions if greenhouse gas reduction targets are not achieved (thousand tons) |
Cost related to carbon tax if greenhouse gas reduction targets are achieved (thousand yen) |
Cost related to carbon tax if greenhouse gas reduction targets are not achieved (thousand yen) |
|---|---|---|---|---|
| 2030 | 110 | 189 | 1,813,440 | 3,130,869 |
| 2050 | 0 | 189 | 0 | 6,055,178 |
1USD=133.36 yen
IEA: NZE Scenario
Carbon tax 2030: 130 USD for developed countries, 90 USD for emerging countries, 15 USD for developing countries
Carbon tax 2050: 250USD for developed countries, 200USD for emerging countries, 55USD for developing countries
Based on the IEA's NZE scenario, we have calculated the financial impact related to the carbon tax for 2030 and 2050.
If emissions are reduced as planned, we assume 110 thousand tons and 0 tons in 2030 and 2050, respectively. On the other hand, if the reduction target is not achieved, emissions in 2030 and 2050 are estimated to be 189 thousand tons each, assuming that the emissions in 2022 will continue. Comparing the case where the reduction target is not achieved and the case where it is achieved, the impact in 2030 is approximately 1.3 billion yen and in 2050 is approximately 6 billion yen.
Risks and Opportunities, Direction of Responses and Measures
According to the results of the scenario analysis, there are areas where yields of agricultural products used as raw materials would decrease in each scenario. Including these impacts, we examined the risks and opportunities facing the Sapporo Group, assuming that the three scenarios become reality.
In terms of risks, we recognize that crop yields could decrease due to abnormal weather, regulations could be tightened, and quality could decline due to pests and diseases. On the other hand, in terms of opportunities, we recognize the stabilization of quality through improved varieties, the development of new varieties, and the enhancement of competitiveness through product development, etc. We believe that by strengthening mitigation and adaptation measures, the impact of risks will be reduced and the potential for capturing opportunities will be greater.
Although the trend of declining yields will occur in each region, we will respond to regional differences by securing diversified sources of procurement. In addition, we will respond to tighter regulations on agricultural chemicals, yield reduction and quality deterioration caused by diseases through “Collaborative Contract Farming System” activities and the development and commercialization of new varieties. These are measures that will be effective in all scenarios.
| Item | Risk and Opportunity | Related items | Impact Period | Financial Impact | Direction of response and measures | ||||
|---|---|---|---|---|---|---|---|---|---|
| Climate change | Natural capital | Short-term | Medium-term | Long-term | |||||
| Risks | Transition risks | Increased energy costs at business sites due to the introduction of carbon pricing | 〇 | 〇 | 〇 | Imposition of carbon tax NZE Scenario (Progress Scenario): 3.13 billion yen in 2030, 6.06 billion yen in 2050 |
|
||
| Increase in costs required to reduce FLAG-related emissions in response to greenhouse gas reduction targets | 〇 | 〇 | 〇 | Understanding the amount of nitrogen fertilizer applied and the associated costs required for its reduction |
|
||||
| Reduction or change in sourcing locations due to the expansion of protected areas for the 30by30 target and the protection of areas managed by IPLCs | 〇 | 〇 | Anticipating an increase in the procurement cost of raw agricultural products |
|
|||||
| Decrease in agricultural yields due to tighter environmental regulations on pesticides (including chemical fertilizers) | 〇 | 〇 | 〇 | 〇 | Increased procurement costs for raw agricultural products Progress Scenario: 200 million yen in 2030, 550 million yen in 2050 Standard Scenario: 130 million yen in 2030, 500 million yen in 2050 Stagnation Scenario: 250 million yen in 2030, 770 million yen in 2050 * Calculation based on the 2022 actual performance standard for beer raw agricultural products |
|
|||
| Increase in agricultural production energy costs due to factors such as carbon pricing | 〇 | 〇 | 〇 | ||||||
| Physical risks | Deterioration of raw agricultural product quality and yield Reduction due to global warming and abnormal weather events | 〇 | 〇 | 〇 | 〇 |
|
|||
| Water scarcity and flooding at business sites due to abnormal weather events (heatwaves, droughts, wind and water damage from typhoons and concentrated heavy rainfall, etc.) (*) | 〇 | 〇 | 〇 | 〇 | 〇 | Assuming losses and restoration costs due to production suspensions |
|
||
| Stagnation in procurement of raw materials due to epidemics of new infectious diseases. | 〇 | 〇 | 〇 | 〇 | Assuming losses due to production suspensions |
|
|||
| Increase in air conditioning costs for equipment caused by rising temperatures | 〇 | 〇 | Assuming an increase in electricity consumption |
|
|||||
| Reduction in yield and quality due to water pollution and the deterioration of soil health | 〇 | 〇 | Assuming an increase in the procurement cost of raw agricultural products and an increase in water purification costs |
|
|||||
| Opportunities | Reduced energy costs (carbon tax) at business sites through reduction of greenhouse gas emissions | 〇 | 〇 | 〇 | NZE Scenario (Progress Scenario): 1.32 billion yen in 2030, 6.06 billion yen in 2050 |
|
|||
| Stable procurement of raw materials through the development of climate-resistant varieties | 〇 | 〇 | 〇 | 〇 | Reduced impact on procurement costs due to broad adoption of new varieties in the industry |
|
|||
| Strengthening competitiveness through the development of raw agricultural products and product development | 〇 | 〇 | 〇 | 〇 | Products using newly developed varieties of barley and hops Market scale after 2030: up to 54.7 billion yen |
||||
| Efficiency improvement in agriculture through the utilization of ICT, robots, etc. Stabilization of quality through breeding |
〇 | 〇 | 〇 | 〇 | Assuming impact on raw agricultural product prices |
|
|||
| Optimization of fertilizer and pesticide application, as well as the reduction of costs and environmental impact through the introduction of energy-efficient machinery | 〇 | 〇 | 〇 | Assuming the cost-reduction effects of inputs and their impact on raw agricultural product prices |
|
||||
| Reduction of water-related risks and costs through improved water use efficiency, as well as the securing and conservation of water sources | 〇 | 〇 | Assuming a reduction in costs related to water management |
|
|||||
| Funding through sustainable finance | 〇 | 〇 | Assuming that access to funding becomes easier |
|
|||||
Transition Plan
Mitigation Measures: Plan to 2030 (Scope 1, 2)
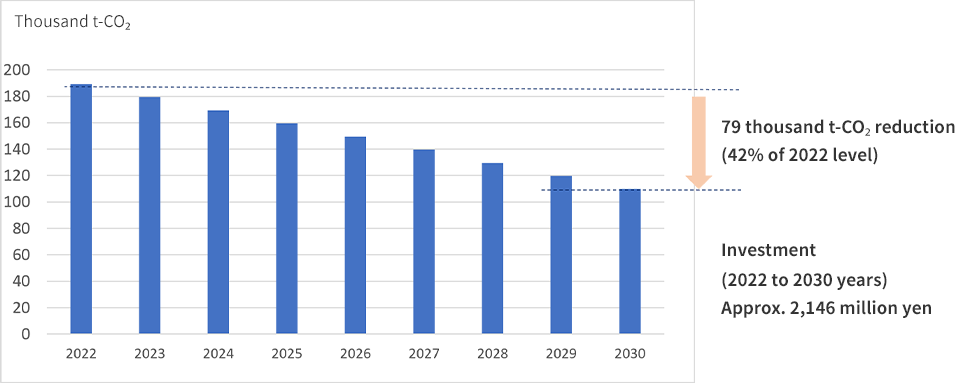
The Sapporo Group has been certified by Science Based Targets Initiative (SBTi) for its greenhouse gas reduction targets. The SBT 1.5°C standard defines the level of reduction each year toward the target year, and we aim to achieve a certain degree of reduction throughout the Group.
To achieve this reduction plan, we will invest approximately 2.1 billion yen in decarbonization over the eight-year period from 2022 to 2030. At production sites, we will promote energy-saving activities such as upgrading to high-efficiency equipment and streamlining processes in line with measures to address aging facilities, as well as a shift to renewable energy, mainly for electricity. For the framework of investment decisions for decarbonization, Internal Carbon Pricing (ICP) has been introduced at major operating companies, and the estimated investment amount of 6,000 yen/t-CO2 has been adopted for the current investment.
Adaptation Measures Plan to 2050
| Year | Barley | Hops |
|---|---|---|
| 2023 |
|
|
| 2024 |
|
|
| 2025 |
|
|
| 2026 |
|
|
| 2027 |
|
|
| 2028 |
|
|
| 2029 |
|
|
| 2030 |
|
|
| 2031-2034 |
|
|
| 2035 |
|
|
| 2036 |
|
|
| 2050 |
|
|
* Notice of partial correction and update as of March 31, 2026 Corrections and updates have been made for the following reasons: Changes to research themes and schedules, as well as other adjustments for greater accuracy.
In our core alcoholic beverages business, the Sapporo Beer Ingredient Development Laboratory serves as a base for developing new breeds in collaboration with universities, research institutes, and suppliers in Japan and overseas. For the main materials of beer, which are expected to be greatly affected by climate change, we are developing breeds with excellent disease resistance and stable yield and quality even in abnormal weather conditions, and aiming for their commercialization.
Indicators and Targets
Among the measures and policies described in the previous section, the following indicators and targets have been set for the initiatives that the Sapporo Group is particularly focusing on.
In mitigation measures such as curbing greenhouse gas emissions, the Sapporo Group has set medium- and long-term targets for reducing greenhouse gas emissions. In the value chain target among them, we have determined reduction activities in cooperative cultivation areas in Japan as one of the specific initiatives to be implemented in the future. We will expand our initiatives to domestic cultivation areas, taking into account pesticide and other regulations.
For adaptation measures to avoid or mitigate damage from climate change impacts, we have set new targets for agricultural products used as key ingredients in our core product, beer. We aim to preserve and manage the genetic resources of barley and hops, and utilize them to develop and commercialize breeds that can address issues such as yield reduction and quality deterioration caused by abnormal weather conditions like drought and heavy rainfall, which are climate-related and nature-related risks, as well as water stress and disease resulting from these conditions.
Mitigation measures
2030
- Reduce greenhouse gas emissions (Scope 1 and 2) from our sites by 42% compared to the 2022 levels
- Reduce greenhouse gas emissions (Scope 3) throughout the value chain by 25% from the 2022 levels
- Reduce greenhouse gas emissions in FLAG scopes 1 and 3 by 31% from the 2022 levels
- Expand our emission reduction activities in all domestic cooperative cultivation areas
2050
- Aim to achieve net zero greenhouse gas emissions in Scope 1, 2, and 3
- Use 100% renewable energy sources for electricity consumption
Adaptation measures
- Apply for registration of new breeds (barley, hops) to adapt to climate change by 2030
- Commercialize new breeds (barley, hops) to adapt to climate change in Japan by 2035
- Develop new environmentally adaptable breeds besides the above breeds and commercialize them in Japan and abroad by 2050
Mitigation Measures for Climate Change and Measures to Reduce Impacts on Nature
Sapporo Group has received SBT certification for FLAG-related greenhouse gas emission reduction targets, becoming the first in Japan to achieve this. FLAG-related greenhouse gas emissions include those associated with land use changes and land management related to the production of the agricultural products we source, as well as N2O emissions from the application of nitrogen fertilizers. Additionally, the application of nitrogen fertilizers is a contributing factor to water pollution, which is one of the impacts on nature.
Therefore, to reduce FLAG-related greenhouse gas emissions and mitigate impacts on nature, we will engage in communication with our largest barley/malt suppliers to track nitrogen fertilizer application and optimize fertilization practices.
By 2030, we aim to achieve 100% implementation of communication efforts to track nitrogen fertilizer application per unit of barley/malt and optimize fertilization practices.
* Sharing our FLAG Scope 1 and 3 targets and conducting on-site visits to collect information on the use of nitrogen-based chemical fertilizers and organic fertilizers
Targets have also been set in the Medium- and Long-term Targets for Key Sustainability Issues, and group-wide efforts are being promoted to achieve these targets.
We will continue to strive to understand and disclose information on risks and opportunities that have not yet been fully analyzed, countermeasures to address them, and their financial impacts. We will also conduct reviews as necessary in response to changes in social conditions.
Sapporo Group Environmental Vision 2050
SAPPORO HOLDINGS LIMITED Sustainability Book 2020
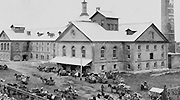
(Sapporo Breweries' Commitment to Over 140 Years of Quality Ingredients – The Challenge of Sapporo Breweries)